Photo Credit: www.datacenterdynamics.com
Where do Power Quality Disturbances Come From?
A study by the Electric Power Research Institute focusing on distributing power to 24 utilities throughout the U.S., tells us that 85% of power disturbances happen because of voltage dips or swells, harmonics, wiring, and grounding problems. It postulates that these mishaps cause a financial loss of more than $156 billion per year. In the industrial world, switching on and off of heavy loads can cause voltage sags and swells. They derail network voltages far past their optimal operating parameters. A lot of this equipment is created to operate within these conditions. These dips and swells are often the culprits of shutdowns and process outages. In the current business atmosphere, a lot of corporations are pondering the installation of locally generated, renewable energy sources. Such as solar and wind. In a lot of instances, distributed generation sources need a switch-mode power supply in their electrical installations. With the need for more power electronics and switching power supplies. Harmonics will play a bigger part in causing problems for industrial equipment. These power supplies can integrate harmonics into their systems. They can corrupt power output so that all that is linked to the supply system are affected. This includes transformers and cables. Plant managers can see the effects of huge harmonic currents. As network elements go way past normal capacity. In several instances, elevations in total losses of 0.1% to 0.5% on network systems can trigger the tripping of protection components. Several other events can cause diminished power quality. These are differential loading of phases, faulty wiring and grounding methods, load interactions, EMI/EMC, and switching to massive reactive systems.
Power Quality Standards
To be able to adapt and maintain power quality, a solid monitoring and reporting method must be used. The standards set in stone by the industry are the IEC-61000-4-30 Class A and Class S. And IEC-61000-4-7 harmonic measurements, and IEC-61000-4-15 for flicker. All have absorbed these power quality standards to set the parameters for operations. Failure to meet these standards can result in steep penalties. Standards not only give a comprehensive baseline for real-world applications. They can also boost user confidence in the data provided for providing answers to issues connected to these events. Measurement precision is the answer for generating solid and replicable output.
Here are a few Power Monitoring Devices:
-
1.Electricity Usage Sensor
This is a device that monitors electrical consumption. It takes the form of a current transformer (CT), clamp, or optical sensor. CT sensor clamps gauge the electromagnetic field of a power cable. Like the clamp meters that electricians carry around. They wrap around the main supply cable or sub-circuit wires in your meter board. Optical sensors work by gauging the pulse output on your utility or kWh sub-meter. The pulse output is a red LED light that blinks in time with your power consumption. Some of these can even measure the more traditional mechanical electricity meters that use spinning disks.
-
2. Transmitter
- Bluetooth or Zigbee – both are short-range but are perfect for multiple purposes. Zigbee often utilizes a smart meter. But you cannot tap into a Zigbee signal without the correct gear.
- 433MHz – the same frequency employed by some remotes, weather stations, and other equipment. Can send data up to 70 meters away.
- Wi-fi – offers a wireless range over the two choices above
- Power Monitor Transmitters are often battery-operated.
-
3. Receiver / Display
The receiver may be a display screen, an internet router, a separate hub, or even a mobile phone. At times, the receiver is an internet entry point that lets you peruse the information elsewhere. Receivers may be battery-powered or plugged into an electrical socket.
Uses of Data Center Power Monitoring Systems
- Watch your energy consumption before you get saddled with an exorbitant power bill
- Optimize solar power provided on-site with solar PV panels
- Inform your family or colleagues about your electricity expenditures
- Discover your stand-by, after hours or overnight energy consumption
- Know early if the power company is overcharging you
- Discover the actual utility of your air conditioning, electric hot water, lighting, and more
- Learn to adjust your daily practices to help you conserve energy
- Lessen your reliance on fossil fuels and reduce your carbon footprint
- Improve PUE numbers
The monitoring of data power centers has remained stagnant for the past two decades. Some monitoring has now become intuitive with the emergence of high-powered processors. This carries a myriad of helpful new additions making data centers more efficient. These include waveform capture, CBEMA ITIC monitoring, and common circuit creation. Here’s a brief overview of these additions:
Waveform Capture
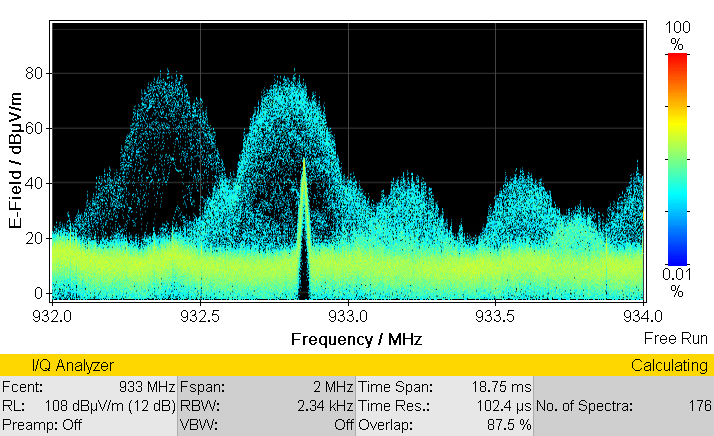
Waveform capture is a feature that instantly takes a high-resolution photograph of voltage and current waveforms after a certain limit is crossed. To be of any utility, these snapshots must include pre and post-event data which needs a continuous rolling log. The system should be able to recover past data capture at 40 points per data cycle resolution. It is also essential that all data captures be performed on all current channels for multi-circuit and branch-circuit meters.
- The advantages of waveform capture are:
Crucial diagnostic information can be utilized to investigate errors, disruptions, and outages. A perfect example is a disruption generated on the load side of the bus, that spreads all over the bus and hits other essential loads. If waveforms are monitored on all branch circuits or feeder breakers, it can be clearly identified which circuit was responsible.

Photo Credit: www.narda-sts.com
- Precautionary load failure examination:
Manual captures can be analyzed next to the benchmark captures to pinpoint increasing aberrations in the loads. This technique may also be used on faulty pumps and chillers. They can even identify dropping power supplies before the disruption of the load. This examination may also be done using an Artificial Intelligence script. Within the monitor to sound off early alerts about differences in load signatures.
CBEMA ITIC Logging
The standard voltage window for IT loads is the CBEMA ITIC curve. Aberrations outside this window have the capacity to disrupt essential loads. But a lot of these breaches are fleeting, and happen either too fast or too slow to identify, as they can last from micro-seconds to minutes. Recognizing variations as they occur needs a monitor that measures the voltage at speeds of 40kHz. This is way past the ability of any existing legacy processors. The emergence of quicker operating processors is now lessening the cost of manufacture and helping to make this technique of monitoring the new standard at the branch circuit level.
Using a data center power monitoring is important in securing the operational stability of the essential bus. In order to be useful, aberrant data needs to include the length, magnitude, and time of the occurrence. It would also be beneficial if the meter can analyze the type of event., such as sag, swell, transient or other forms. By documenting this information, any occurrences can be thoroughly investigated for a root cause. Moreover, these occurrences can go uncorrected until they disrupt the essential bus. Vigilant monitoring is an important early warning measure that notifies an operator of certain signs before an untoward event happens.
Common Circuit Creation
With Muti-Circuit Monitors, readings are commonly displayed as per circuit data. Leaving it up to the BMS/DCIM to calculate the result of any multi-phase circuit. In order to be useful, monitors should be able to organize circuits to add up the result for the circuit breaker. This characteristic will facilitate the mathematical calculation of the neutral even without a neutral CT. This method is a hundred percent precise. Common Circuit Creation also integrates with BMS/DCIMs easily.
Conclusion
Here we have presented you with a few tools and techniques that give you a glimpse of the next generation of data center power monitoring. We have also shown you the most optimal daily uses of data center power monitoring systems. They will allow you to change your lifestyle and adjust your power consumption to get the best use of the energy that you consume. It also lessens your reliance on fossil fuels and reduces your carbon footprint. But the technology changes and advances itself daily. And constant vigilance and monitoring of brand new techniques and tools will keep you up to date with the latest in this field. With these helpful tips, you can maximize your income stream and increase the efficiency of your power sources. We hope that this article was both helpful and informative.


